要使用「Grafana」完成「Traceroute Map Panel」必須先滿足以下條件
1. Centos 8 或 Centos 8 Steam 系統
2. Linux MTR Tools 版本 0.94 以上
3. 安裝「influxdb」( 時間序資料庫)
4. 安裝「Telegraf」 (客戶端採集資料)
~~ 那麼接下來我們開始嚕 ~~
#==修改「電腦」名稱====
hostnamectl set-hostname influxdb
#==關閉「selinux 」======
#關閉「Selinux」為「disabled」才不會阻擋「服務連線」服務
sed -i 's/SELINUX=enforcing/SELINUX=disabled/' /etc/selinux/config
setenforce 0
#==開啟「Influx DB」允許端口 ==
sudo firewall-cmd --add-port=8086/tcp --permanent
sudo firewall-cmd --reload
#== Install Mtr 0.94 以上版本 ==
#離線安裝「mtr」0.94 版本 不能使用「yum」
yum localinstall /opt/mtr-0.94-2.hs.el8.x86_64.rpm -y
#檢查「mtr」版本
mtr -v
#== Install Influx DB (資料庫) ==
#建立「InfluxDB」Yum 源
cat <<EOF | sudo tee /etc/yum.repos.d/influxdb.repo
[influxdb]
name = InfluxDB Repository - RHEL \$releasever
baseurl = https://repos.influxdata.com/rhel/\$releasever/\$basearch/stable
enabled = 1
gpgcheck = 1
gpgkey = https://repos.influxdata.com/influxdb.key
EOF
#安裝「influxdb」
yum install influxdb -y
#啟動「influxdb」
systemctl start influxdb
#開機啟動「influxdb」
systemctl enable influxdb
#進入「influx」資料庫 default 使用 admin 登入
influx
# 建立「route」帳戶 並設定 密碼「passwd」
CREATE USER route WITH PASSWORD 'passwd'
#建立「traceroute」資料庫
create database traceroute
#賦予「route」帳戶 擁有 「traceroute」資料庫 讀/寫 權限
GRANT all ON traceroute TO route
#顯示「資料庫」
show databases
#建立「資料庫」保存週期90天
create retention policy "limlt_90_day" on "traceroute" duration 90d replication 1 default
#== Install Telegraf ( 數據採集客戶端工具 ) ===
#線上安裝「telegraf」
yum install telegraf.rpm -y
#編輯「telegraf」設定文檔
vi /etc/telegraf/telegraf.conf
# # Read metrics from one or more commands that can output to stdout ( 配置 採集內容 )
PS. 解析「8.8.8.8」、「233.5.5.5」路由
# interval = 60s 每一分鐘執行一次。
[[inputs.exec]]
commands=[
"mtr -C -n 8.8.8.8" ,
"mtr -C -n 223.5.5.5"
]
interval = "60s"
timeout = "120s"
data_format = "csv"
csv_skip_rows = 1
csv_column_names=[ "", "", "status","dest","hop","ip","loss","snt","", "","avg","best","worst","stdev"]
name_override = "mtr"
csv_tag_columns = ["dest", "hop", "ip"]
# Configuration for sending metrics to InfluxDB ( 配置 輸出 資料庫 內容 )
[[outputs.influxdb]]
urls = ["http://127.0.0.1:8086"]
database = "traceroute"
retention_policy = ""
write_consistency = "any"
timeout = "120s"
#啟動「telegraf」
systemctl start telegraf
#開機啟動「telegraf」
systemctl enable telegraf
#===== InfluxDB 驗證資料(等待1分鐘) ===
#「登入」InfluxDB 驗證資料寫入
influx -host 'localhost' -port '8086' -username 'route' -password 'passwd'
#指定「traceroute」資料庫 並 顯示「資料表」( measurements ) 找到「mtr」資料表
use traceroute
show measurements
#查詢「mtr」資料表 及前「5」筆資料。
select * from mtr limit 5
#=== 開始配置 Grafana ===
#安裝「gowee-traceroutemap-panel」插件
grafana-cli plugins install gowee-traceroutemap-panel
#重新啟動「Grafana」
sudo systemctl restart grafana-server
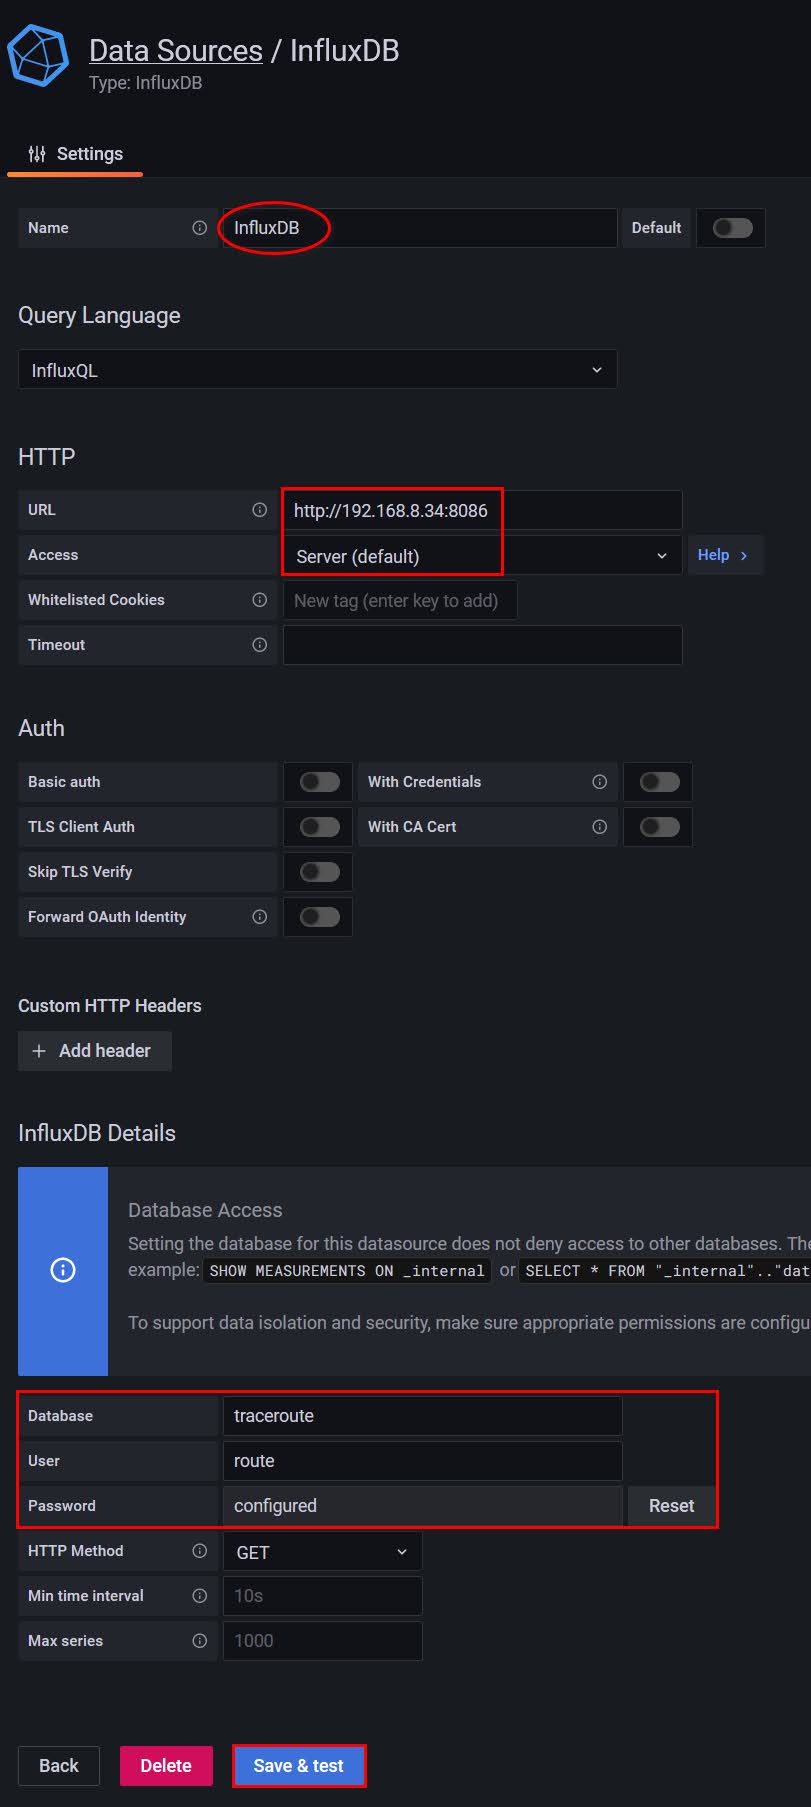
#設定「influxdb」來源
# Grafana 添加「Traceroute Map Panel」Dashboard 並填入「InfluxDB」SQL 就完成了
select mean(avg) as rtt, mean(loss) as loss from mtr WHERE ${__to}ms - 5m <= time AND time <= ${__to}ms group by hop, ip, host, dest
參考資料
「Grafana」-「Traceroute Map Panel」
「Gowee」-「traceroute-map-panel」

.png)
.png)